Day 4: Collecting Data & Graphing Basics
Students will Run their Experiments today based on their own question & hypothesis |
| ||
The following experiment example will be based on the following Scientific Dialogue:
Science dialogue:
Original Question:
Original Hypothesis:
Revised Question:
Revised Hypothesis:
- Why did we get different results (number of drops - DV)?
Original Hypothesis:
- It's because we dropped the droplets at different heights (IV).
Revised Question:
- How does height (IV) affect the number of drops (DV) a penny can hold?
Revised Hypothesis:
- If I increase the height (IV)
- Then the number of drops (DV) the penny can hold will decrease
- Because (whatever my reasons are - aka hypothesis)
Experimental Design
- In the experimental design section - students are to describe the experiment in general terms based on their If/Then statements.
- Next, they list all of the materials.
- Finally, students list a step by step process on how they are more specifically going to carry out their experiment.
Example of Experimental Design:
To test this hypothesis out, I will set the dropper at 2 cm intervals starting at 2 cm to about 20 cm and count the number of drops the penny can hold.
|
Materials:
|
Procedures:
|
Next run the lab/experiment
Photos of Students running the lab described above
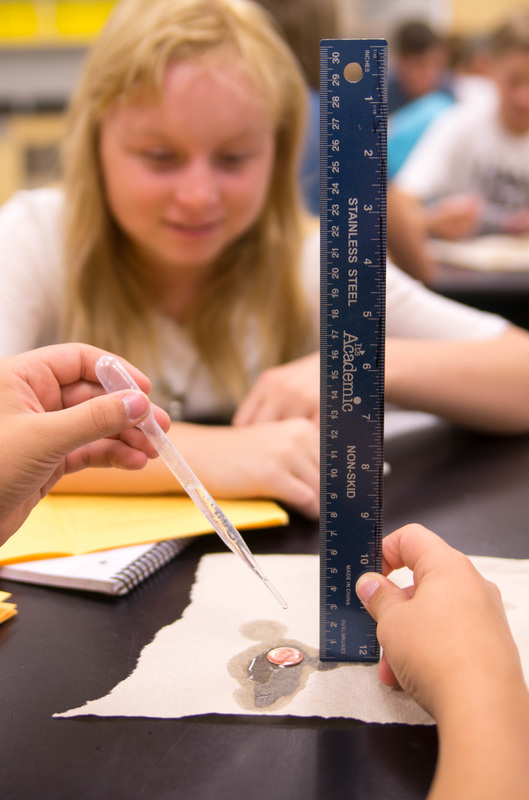
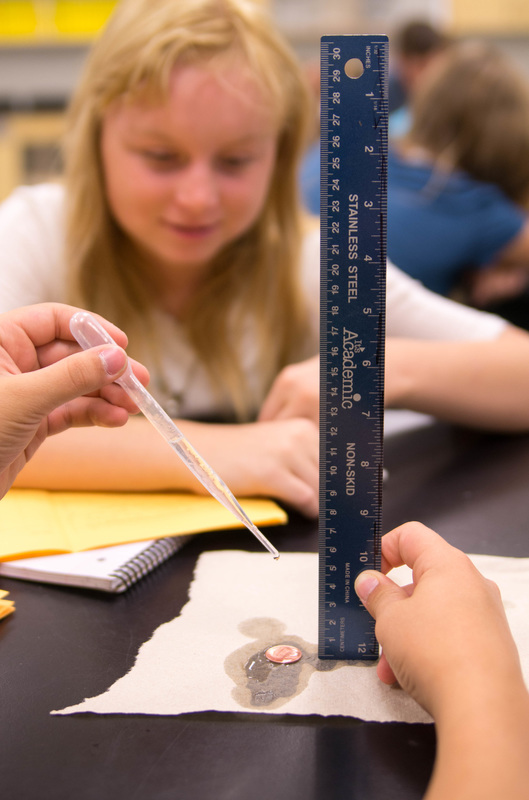
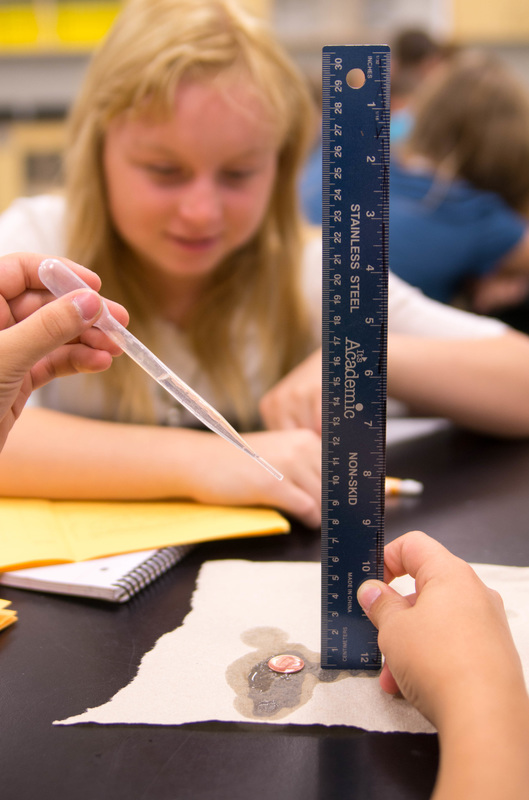


At this point in the write up students would then have run their experiments and collect data based on their findings; however, before you let them launch off into their experiments - explain the following sections and explain your expectations.
Qualitative Observations
Everybody is expected to make at least 2-4 qualitative observations.
Some experiments will only make qualitative observations - they need to make at least 6 deeply solid observations that will help answer their question.
What makes a good qualitative observation are the descriptive observations on the experiment of things that might affect the outcome of the experiment - or a phenomenon that occurs during the experiment.

Some observations might look like this:
- As we dropped the water up close, the water absorbed the water drops and behaved similar to jello and jiggled a bit.
- As we increased our droppers height around 6-8 cm in height, we noticed that the jiggling got more violent.
- As we increased our height past 10 cm, we noticed that the water kept splattering.
- It seems that the penny cannot hold any water at all.
- It appeared that the volume of the drops seemed consistent.
Graphing Basics
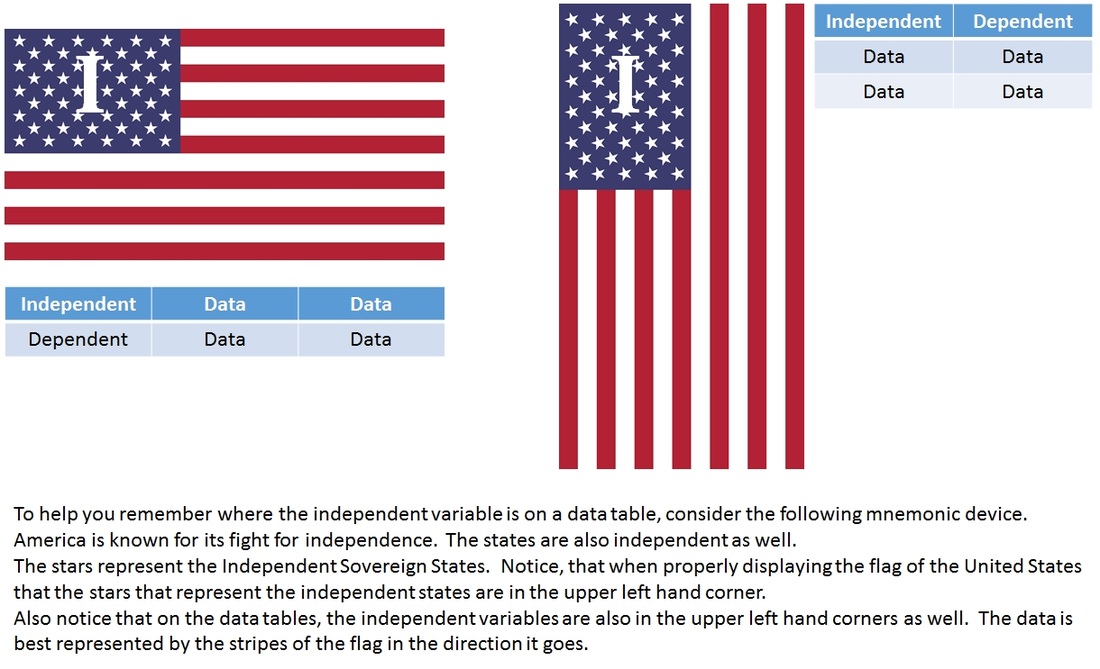
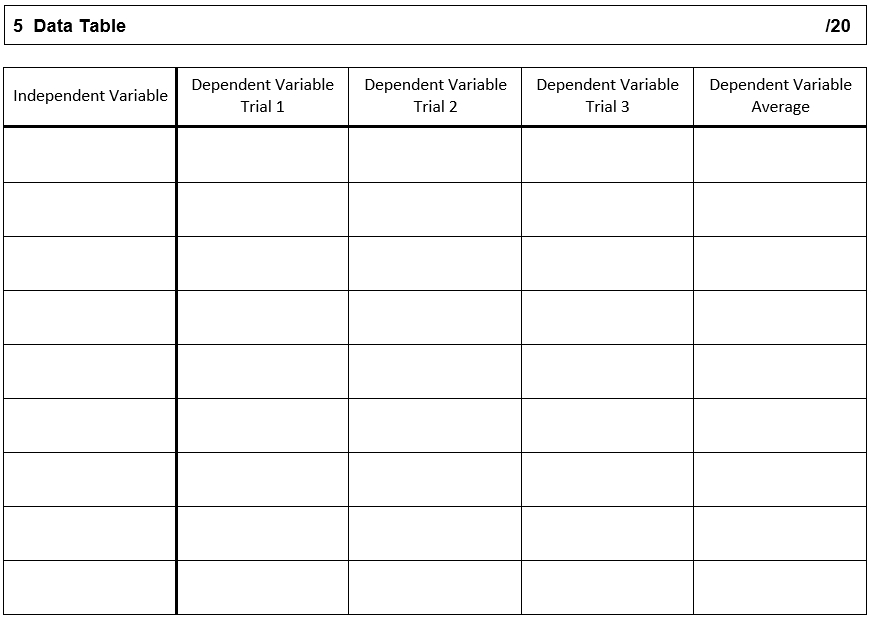
Data Table
In setting up your data table - the first column is the independent variable. The subsequent columns are the trials of the dependent variable. If you do trials - you need to take the average of the trials. If trials are a part of your experiment - then you will ONLY focus on and graph the dependent variable average, and YOU WILL NOT need to graph any of the trials. It's not necessary.

How to set up the data table:
How to determine what graph to use:
- Use a Line Graph if the independent & dependent values are numbered based
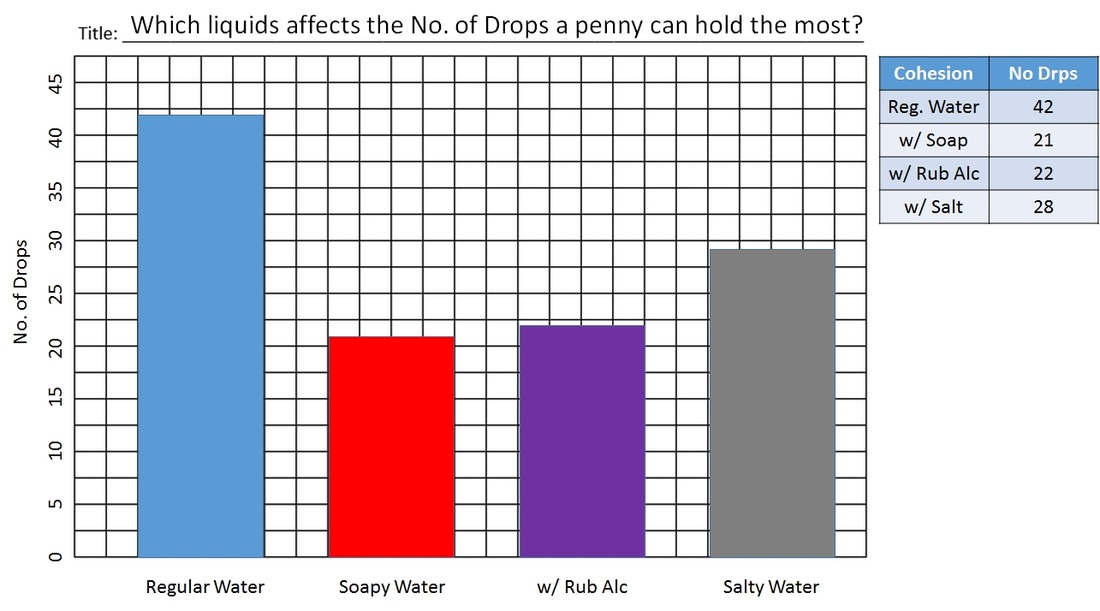
- Use a Bar Graph if the independent is word based and the dependent value is numbered based
- Use a matrix if both the independent and dependent are word based.
Graphing Basics Continued...
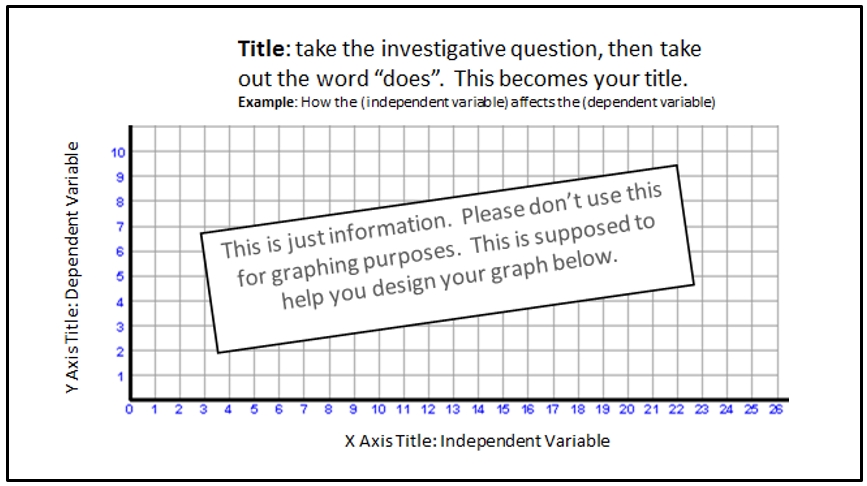
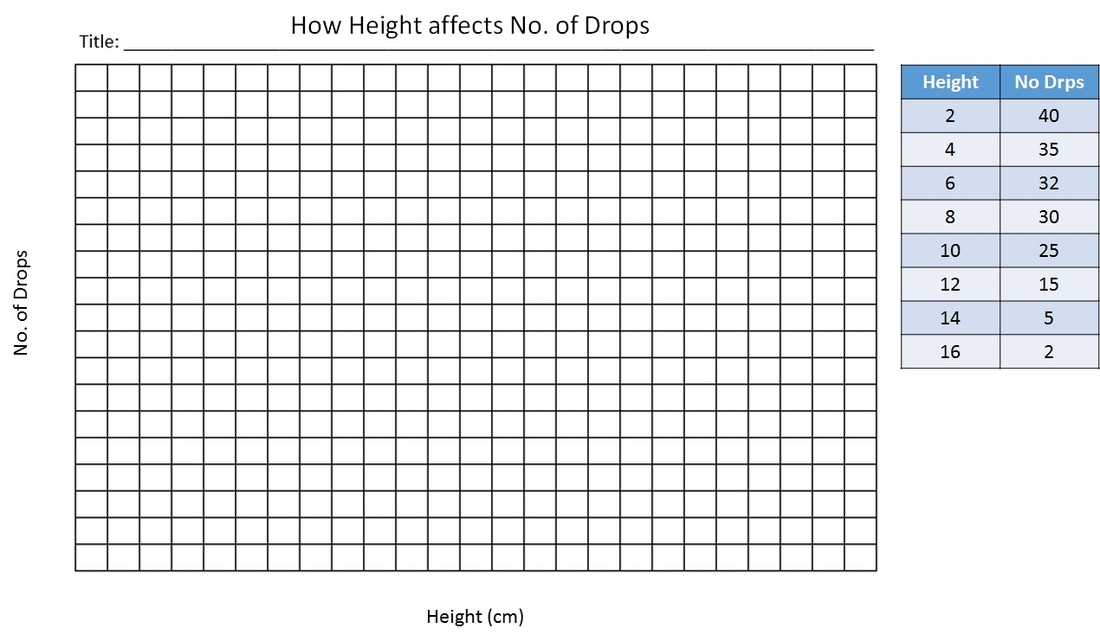
Setting up the graph |
|
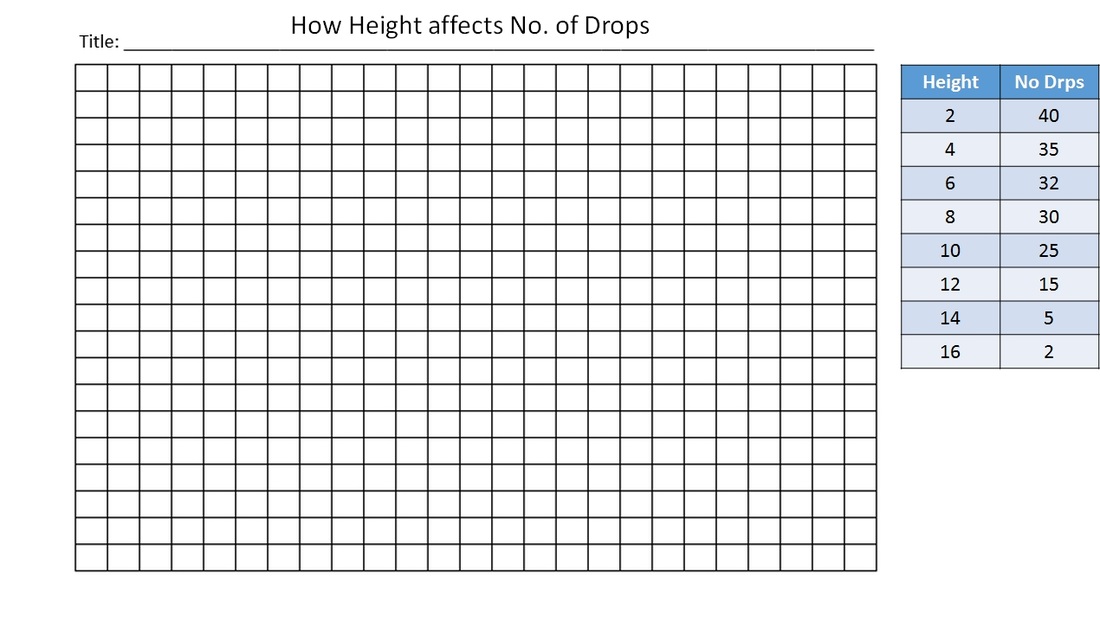
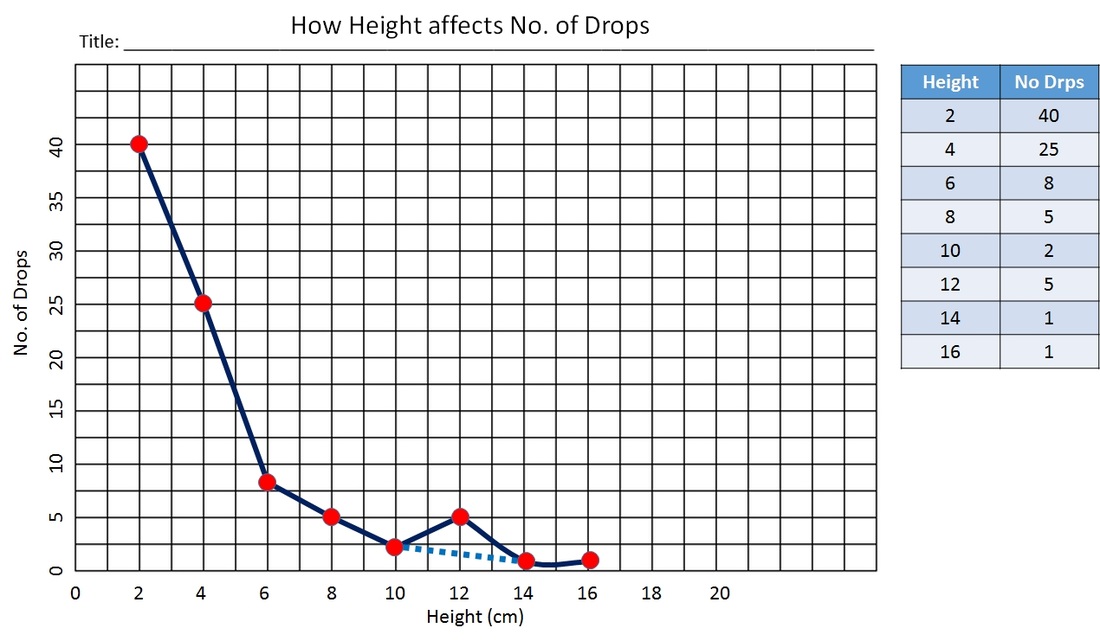
The title of the graph is simply the revised question without the word does. i.e. How height affects the number of drops.
On the X axis is the independent variable - in the class example - it would be "Height" complete with a scale.
On the Y axis is the dependent variable - in the class example it would be "No. of Drops" complete with a scale.
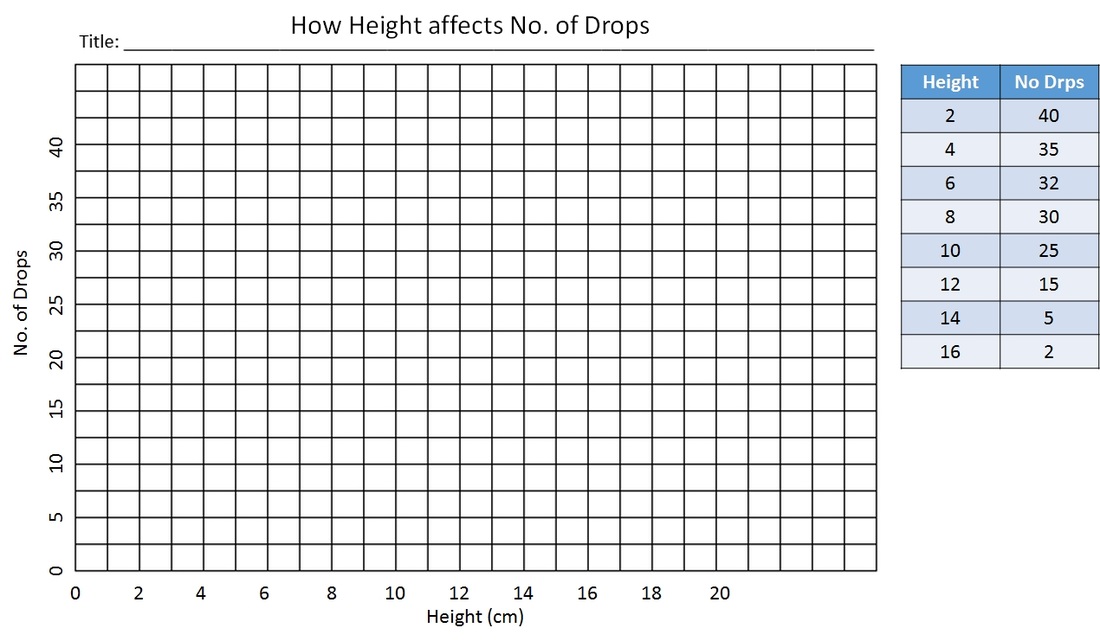
To develop a scale, look at the range of your data and divide it by the number of lines you wish to use. Find what multiple comes the closest with the range you're using.
Example:
If your range of data for the independent variable is from 0 - 50 and the number of lines available is 25, then use the multiples of 2.
Make sure that the numbers are aligned ON THE LINE and NOT BETWEEN THE LINES.
On the X axis is the independent variable - in the class example - it would be "Height" complete with a scale.
On the Y axis is the dependent variable - in the class example it would be "No. of Drops" complete with a scale.
To develop a scale, look at the range of your data and divide it by the number of lines you wish to use. Find what multiple comes the closest with the range you're using.
Example:
If your range of data for the independent variable is from 0 - 50 and the number of lines available is 25, then use the multiples of 2.
Make sure that the numbers are aligned ON THE LINE and NOT BETWEEN THE LINES.
Graphing examples

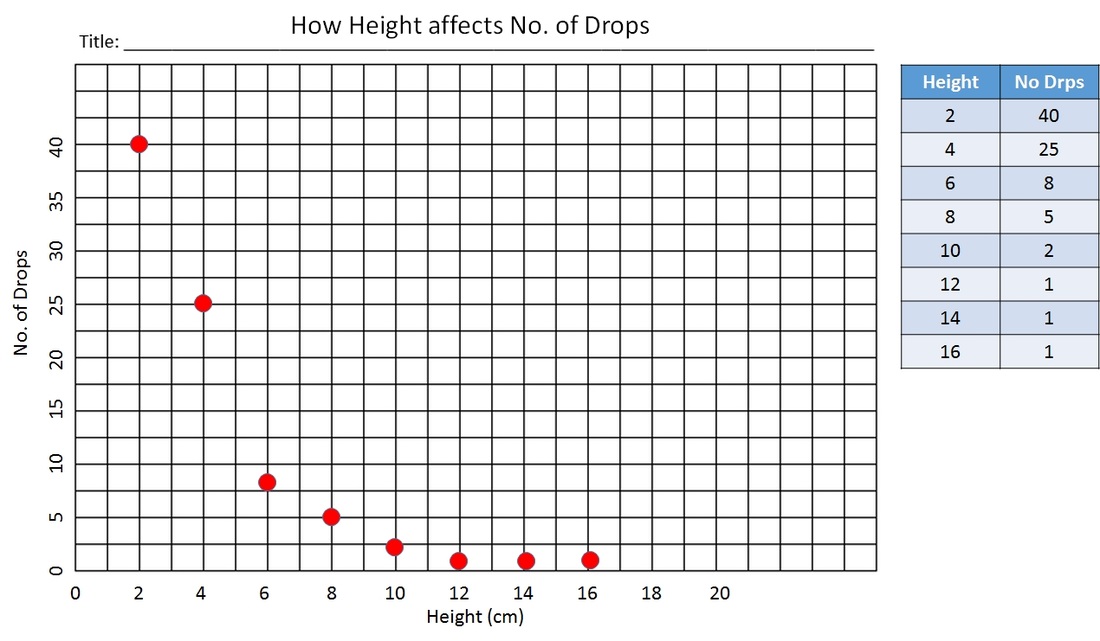

Common Graphing malpractices
- Placing the numbers in between the lines
- Using the data as your scale
- Connecting (0,0) to the first dot of data
Data Analysis:
|
Line Graph Analysis:
|
|
|
Bar Graph Analysis:
Look for clues that might answer your revised experimental question. |
|
Data Analysis Example:
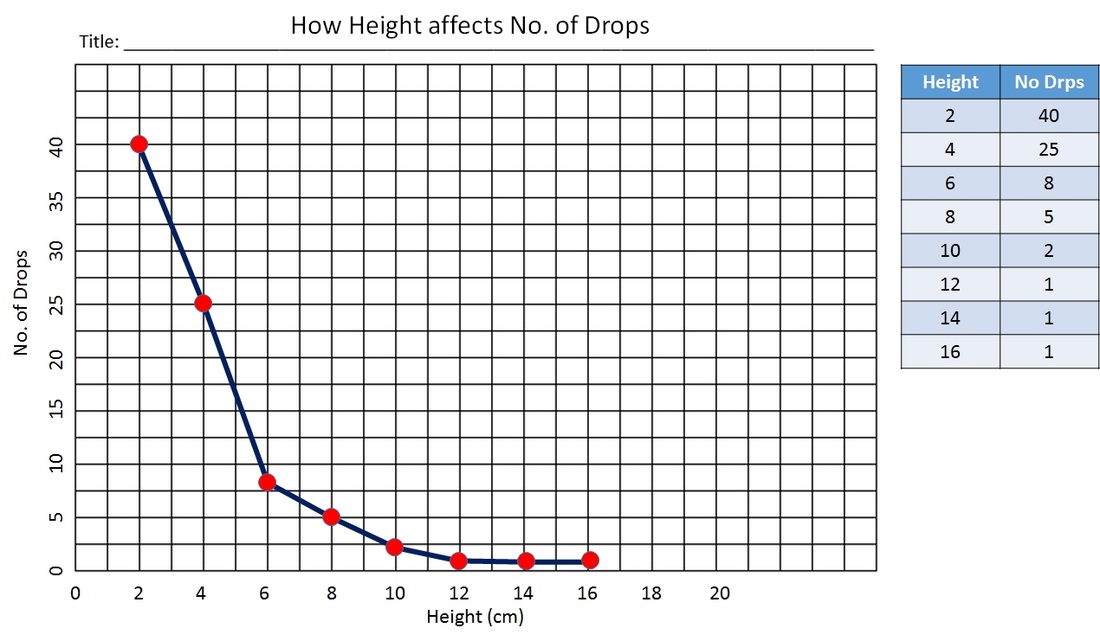
- The most we got was 40 drops while the dropper was really close to the penny.
- As we increased the height, the number of drops was going down.
- The lowest we were able to measure was 1 - only because it kept splattering.
- We did notice that around 12 cm - we seemed to have a bump in our graph - we think it may have been due to smaller drop sizes.
- The major trend is in the downward direction - meaning that as we increased the height of the dropper the less drops the penny was able to hold.
- We think the main reason this is the case is the amount of energy involved. As we increased the height, the speed of the drop increased and was going too fast by the time it hit the penny - making it splatter instead of quietly being absorbed with the other droplets.
Conclusion
Summarize
o Question & Hypothesis
o Procedures
o Observations, Trends, Results & Data Analysis related to the question / hypothesis.
o Experimental errors - things that occurred during the experiment that was not controlled or consistent.
Final Concluding statements
o Conclusion 1:
§ Does the data support or reject your original hypothesis?
o Conclusion 2:
§ Explain the “why” behind the phenomenon that you witnessed and provide the reasoning to support why your hypothesis is correct or incorrect.
§ Use your findings to give deeper insights in your research.
Next Steps:
o How can we apply what you learned to help explain other phenomenon?
o What new questions did you have based on your findings & observations?
o What is the next step in your research
Conclusion Example:
In our experiment, we were examining how height affects the ability of a penny to hold drops of water. To test this out, we took a dropper of water and dropped it on the penny at various heights - starting with 2 cm all the way up to 16 cm in height.
What we noticed was that as we increased the height of the dropper - the amount of drops the penny was able to hold went significantly down - fairly quickly, and seemed to minimize around 12 drops. We also noticed that as we increased our height that the drops seemed to splatter on the penny instead of being absorbed by a dome of water. In fact, we noticed that there was no dome formation as we increased our height. We did notice that we had a blip in the graph near 12 cm in height. We're not sure why we got 5 drops when we dropped it at 12 cm - it could be perhaps Johnny was forming smaller drops somehow.
What this shows us is that our hypothesis is so far correct - in that as you decrease height the number of drops increases - therefore, height does affect the number of drops a penny can hold. In fact, the higher the dropper is, the less drops the penny can hold. We think it might have something to do with the level of energy and speed of the drop upon impact. We feel that as the drop is descending from the dropper, it picks up speed. Therefore, the higher the dropper, the faster the drop goes. What we'd like to investigate next is to see if a drop of water does accelerate as it falls towards the ground before impact and to measure that rate of acceleration.
